Deploying a Netflix Clone on EKS Using a DevSecOps Pipeline

Introduction
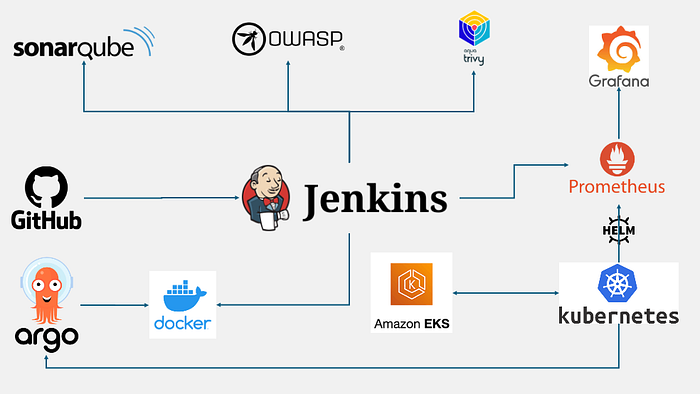
In today’s fast-paced digital landscape, deploying applications securely and efficiently is paramount. As a DevOps Engineer passionate about streamlining deployment processes while maintaining robust security, I recently embarked on an exciting project: deploying a Netflix clone application on Amazon EKS (Elastic Kubernetes Service) using a comprehensive DevSecOps pipeline.
This project aimed to accomplish several key objectives:
- Implement a CI/CD pipeline while integrating security best practices
- Leverage containerization and orchestration technologies for scalable deployment
- Establish comprehensive monitoring and observability
- Gain hands-on experience with cloud-native technologies
In this blog post, I’ll walk you through the entire process, from development to production deployment, highlighting key decisions, challenges faced, and lessons learned along the way.
Phase 1: Development Process
Setting Up the Environment
The project kicked off with the creation of an EC2 instance (Ubuntu 22.04, t2.large) to serve as my development environment. Here, I installed essential tools, with Docker being a cornerstone of my setup. Containerizing my Netflix clone application using Docker ensured consistent environments across all stages of my pipeline, from development to production.
Creating a TMDB API Key
My Netflix clone relies on the TMDB (The Movie Database) API for fetching movie data. To get started:
- Sign up on the TMDB website
- Navigate to the API section under your profile
- Create a new API key
This key is crucial for populating my application with real movie data.

Building and Pushing the Application Image
With my environment set up, I proceeded to build my application image:
docker build --build-arg TMDB_V3_API_KEY=<your-api-key> -t netflix .After thorough local testing to verify functionality, I pushed the image to DockerHub, making it reliable for deployment of the pipeline.

Phase 2: Security Integration
Security is not an afterthought in DevSecOps; it’s an integral part of the entire process. Here’s how I baked security into my pipeline:
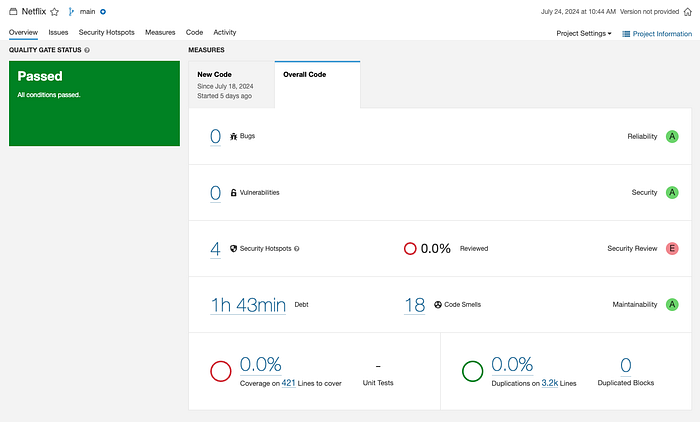
Static Code Analysis with SonarQube
I integrated SonarQube to perform static code analysis, helping me identify code smells, bugs, and vulnerabilities early in the development process. This proactive approach allowed me to address issues before they made their way into production.

Docker Image Scanning with Trivy
Trivy was employed to scan my Docker images for known vulnerabilities:
trivy image <imageid>This step ensured that my containerized application and its dependencies were free from known security issues.
Dependency Checks with OWASP
I used OWASP Dependency-Check to identify vulnerabilities in my project dependencies, ensuring that all libraries and frameworks used in my application were secure and up-to-date.

Phase 3: CI/CD Setup and Deployment
Orchestrating the Pipeline with Jenkins
Jenkins served as the backbone of my CI/CD pipeline, automating my build, security scans, and deployment processes. Here’s a simplified version of my Jenkins pipeline:
pipeline{
    agent any
    tools{
        jdk 'jdk17'
        nodejs 'node16'
    }
    environment {
        SCANNER_HOME=tool 'sonar-scanner'
    }
    stages {
        stage('clean workspace'){
            steps{
                cleanWs()
            }
        }
        stage('Checkout from Git'){
            steps{
                git branch: 'main', url: 'https://github.com/Aj7Ay/Netflix-clone.git'
            }
        }
        stage("Sonarqube Analysis "){
            steps{
                withSonarQubeEnv('sonar-server') {
                    sh ''' $SCANNER_HOME/bin/sonar-scanner -Dsonar.projectName=Netflix \
                    -Dsonar.projectKey=Netflix '''
                }
            }
        }
        stage("quality gate"){
           steps {
                script {
                    waitForQualityGate abortPipeline: false, credentialsId: 'Sonar-token'
                }
            }
        }
        stage('Install Dependencies') {
            steps {
                sh "npm install"
            }
        }
        stage('OWASP FS SCAN') {
            steps {
                dependencyCheck additionalArguments: '--scan ./ --disableYarnAudit --disableNodeAudit', odcInstallation: 'DP-Check'
                dependencyCheckPublisher pattern: '**/dependency-check-report.xml'
            }
        }
        stage('TRIVY FS SCAN') {
            steps {
                sh "trivy fs . > trivyfs.txt"
            }
        }
        stage("Docker Build & Push"){
            steps{
                script{
                   withDockerRegistry(credentialsId: 'docker', toolName: 'docker'){
                       sh "docker build --build-arg TMDB_V3_API_KEY=<your-api-key> -t netflix ."
                       sh "docker tag netflix mmustafa1/netflix:latest "
                       sh "docker push mmustafa1/netflix:latest "
                    }
                }
            }
        }
        stage("TRIVY"){
            steps{
                sh "trivy image mmustafa1/netflix:latest > trivyimage.txt"
            }
        }
        stage('Deploy to container'){
            steps{
                sh 'docker run -d -p 8081:80 mmustafa1/netflix:latest'
            }
        }
    }
}
This pipeline ensures that every code change goes through rigorous testing and security checks before deployment.
Phase 4: Kubernetes Setup on Amazon EKS
Creating the EKS Cluster
To set up my Kubernetes environment, I chose to use Amazon EKS (Elastic Kubernetes Service). Instead of using CLI tools, I opted for the AWS Management Console to create my EKS cluster and node group. This approach gave me a more visual and intuitive way to configure my cluster settings.

After creating the cluster through the console, I connected to it using the AWS CLI:
aws eks update-kubeconfig --region <my-region> --name <my-cluster-name>This command updated my kubeconfig file, allowing me to interact with my EKS cluster using kubectl.
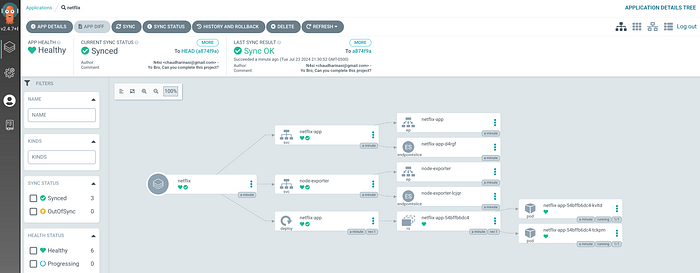
Phase 5: Deploy Application with ArgoCD
Install ArgoCD
You can install ArgoCD on your Kubernetes cluster by following the instructions provided in the EKS Workshop documentation.
Set Your GitHub Repository as a Source
After installing ArgoCD, you need to set up your GitHub repository as a source for your application deployment. This typically involves configuring the connection to your repository and defining the source for your ArgoCD application. The specific steps will depend on your setup and requirements.
Create an ArgoCD Application:
- name: Set the name for your application.
- destination: Define the destination where your application should be deployed.
- project: Specify the project the application belongs to.
- source: Set the source of your application, including the GitHub repository URL, revision, and the path to the application within the repository.
- syncPolicy: Configure the sync policy, including automatic syncing, pruning, and self-healing.
Access your Application
To Access the app make sure port 30007 is open in your security group and then open a new tab and paste your <NodeIP>:30007, your app should be running.

Phase 6: Monitoring and Observability
After successfully deploying my application, the next crucial step was to establish robust monitoring and observability. This phase was critical to ensure the health, performance, and security of my Netflix clone in the production environment.
Setting Up Prometheus and Grafana on a New Server
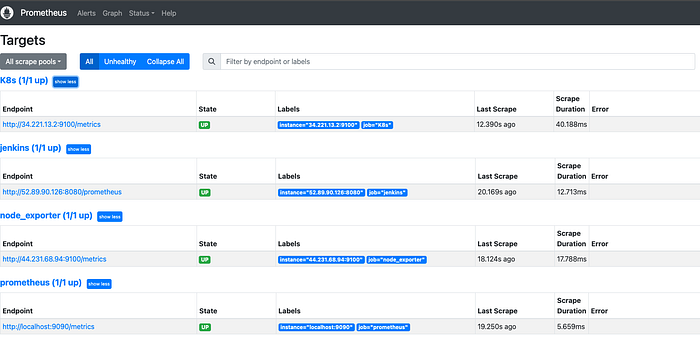
I set up Prometheus and Grafana on a new EC2 Ubuntu 22.04 instance for monitoring. Prometheus was configured to collect metrics from Jenkins and Kubernetes, while Grafana provided visualization through customizable dashboards.
Installing Prometheus and Node Exporter
Create a system user and download Prometheus and Node Exporter.
sudo useradd --system --no-create-home --shell /bin/false prometheus
wget https://github.com/prometheus/prometheus/releases/download/v2.47.1/prometheus-2.47.1.linux-amd64.tar.gz
tar -xvf prometheus-2.47.1.linux-amd64.tar.gz
sudo mv prometheus-2.47.1.linux-amd64/prometheus /usr/local/bin/
sudo mkdir -p /etc/prometheus /data
sudo mv prometheus-2.47.1.linux-amd64/prometheus.yml /etc/prometheus/
Create systemd service file for Prometheus:
sudo nano /etc/systemd/system/prometheus.servicePrometheus service configuration:
[Unit]
Description=Prometheus
Wants=network-online.target
After=network-online.target
[Service]
User=prometheus
ExecStart=/usr/local/bin/prometheus --config.file=/etc/prometheus/prometheus.yml --storage.tsdb.path=/data
Restart=always
[Install]
WantedBy=multi-user.target
Enable and start Prometheus:
sudo systemctl enable prometheus
sudo systemctl start prometheus
Install and Configure Grafana
Install Grafana and configure it to use Prometheus as a data source:
sudo apt-get update
sudo apt-get install -y grafana
sudo systemctl enable grafana-server
sudo systemctl start grafana-server
Access Grafana at http://<your-server-ip>:3000 and configure it to connect to Prometheus.

Monitor Kubernetes Cluster
Prometheus is a powerful monitoring and alerting toolkit, and I used it to monitor my Kubernetes cluster. Additionally, I installed the Node Exporter using Helm to collect metrics from my cluster nodes.
Install Node Exporter using Helm
To begin monitoring my Kubernetes cluster, I installed the Prometheus Node Exporter. This component allows me to collect system-level metrics from my cluster nodes. Here are the steps I followed to install the Node Exporter using Helm:
Add the Prometheus Community Helm repository:
helm repo add prometheus-community https://prometheus-community.github.io/helm-chartsCreate a Kubernetes namespace for the Node Exporter:
kubectl create namespace prometheus-node-exporterInstall the Node Exporter using Helm:
helm install prometheus-node-exporter prometheus-community/prometheus-node-exporter --namespace prometheus-node-exporterUpdate your Prometheus configuration (prometheus.yml) to add a new job for scraping metrics from Node Exporter. You can do this by adding the following configuration:
- job_name: 'node-exporter'
  metrics_path: '/metrics'
  static_configs:
    - targets: ['<nodeip>:9100']
Replace <nodeip> with the IP addresses of your nodes where Node Exporter is running.
Reload or restart Prometheus to apply these changes to your configuration.

This setup allowed Prometheus to collect metrics from my Kubernetes nodes using Node Exporter, providing valuable insights into the health and performance of my cluster.
With this monitoring solution in place, I now had comprehensive, real-time insights into the performance and health of both my application and the underlying infrastructure. This visibility proved invaluable for proactive issue detection and capacity planning.
Challenges and Solutions
Throughout this project, I encountered several challenges:
AWS IAM Integration with Kubernetes:
One of the main challenges I faced was configuring the correct permissions for accessing the Kubernetes cluster. By default, only the IAM user who created the cluster has access to it.
- Solution: I had to carefully study and implement the AWS IAM Authenticator for Kubernetes. This involved editing the aws-auth ConfigMap in the kube-system namespace to grant access to additional IAM users or roles. Here’s an example of how I modified the ConfigMap:
apiVersion: v1
kind: ConfigMap
metadata:
  name: aws-auth
  namespace: kube-system
data:
  mapUsers: |
    - userarn: arn:aws:iam::ACCOUNT-ID:user/NewUser
      username: NewUser
      groups:
        - system:masters
This process required a deep dive into AWS IAM and Kubernetes RBAC (Role-Based Access Control) to ensure secure yet appropriate access to the cluster.
EKS Networking Complexities:
Setting up proper networking for the EKS cluster, especially regarding security groups and VPC configuration, proved challenging.
- Solution: I thoroughly studied AWS networking concepts and used a combination of the AWS Management Console and CloudFormation templates to manage my network infrastructure. This allowed me to have both visual control and infrastructure-as-code benefits.
Future Improvements
While my current setup is robust, there’s always room for improvement:
- Enhance Security with Service Mesh: Implement a service mesh like Istio to provide additional security features such as mutual TLS and fine-grained traffic management.
- Implement Cost Optimization: Utilize tools like Kubecost to monitor and optimize my cloud spending, ensuring I’m using my resources efficiently.
- Infrastructure as Code with Terraform: Implement Terraform to manage and version control my entire infrastructure. This would allow for more consistent and reproducible deployments across different environments, easier collaboration among team members, and the ability to quickly spin up or tear down entire environments. Terraform can be used to manage AWS resources, Kubernetes deployments, and even application configurations, providing a single source of truth for the entire infrastructure.
Conclusion
Deploying my Netflix clone on EKS using a DevSecOps pipeline was a challenging yet rewarding experience. It allowed me to implement best practices in continuous integration, continuous deployment, and security while leveraging the power of Kubernetes for scalable and resilient applications.
This project has not only resulted in a robust, secure deployment of my application but has also significantly enhanced my skills in cloud-native technologies and DevSecOps practices.
Remember, the journey doesn’t end here. As technologies evolve and new best practices emerge, continual learning and improvement are key to staying at the forefront of DevSecOps.
For a detailed, step-by-step guide and all the code used in this project, check out my GitHub repository.
